Roblox Game Revenue Estimator: Why Genre Matters More Than Traffic
A Simulator and an Obby with identical 50,000 daily visits can land nearly 5x apart in monthly revenue — purely from genre-driven conversion rate. Here's the real formula.
Roblox Game Revenue Estimator: Why Genre Matters More Than Traffic
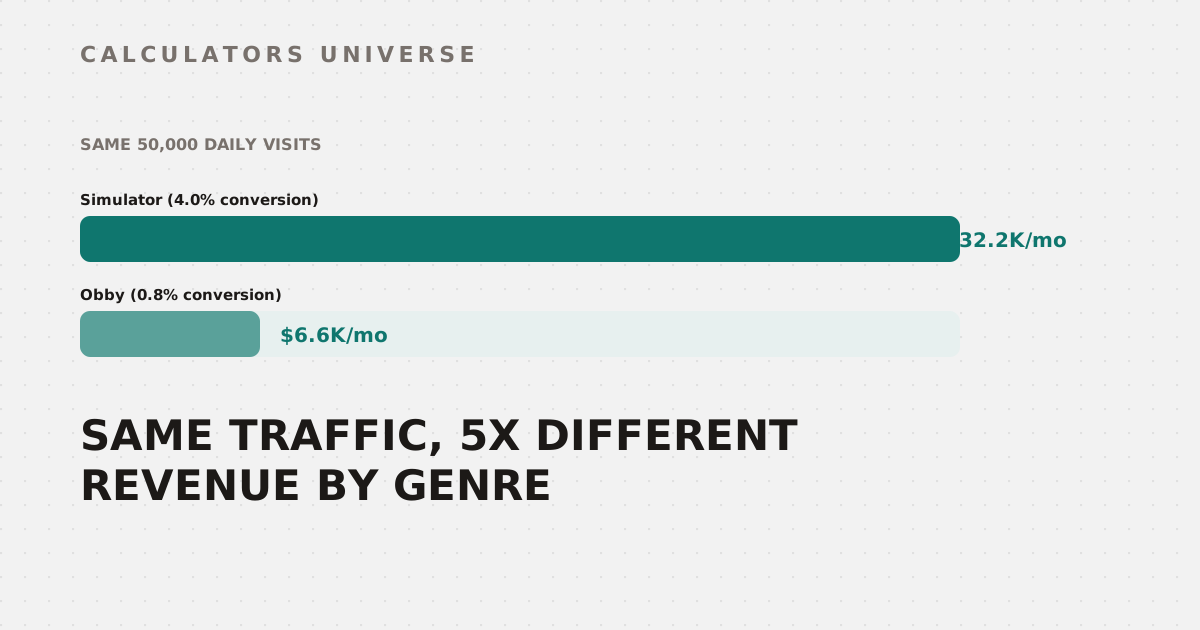
A Simulator and an Obby game with the exact same 50,000 daily visits and identical game pass pricing can land nearly 5x apart in monthly revenue — roughly $32,200 versus $6,600 — purely because Simulators convert visitors into paying players at 4.0% on average while Obbies convert at just 0.8%. Traffic gets all the attention in Roblox creator discussions, but conversion rate is the multiplier that actually decides which of those two numbers you end up with. The Roblox Game Revenue Estimator models this exactly, so here’s the real formula behind it.
What Is a Roblox Game Revenue Estimator?
A Roblox game revenue estimator projects a creator’s earnings by combining three independent revenue channels, applying Roblox’s platform fee, and converting the result to USD:
Daily gross Robux = Game Pass Robux + Developer Product Robux + Premium Payout Robux
Daily net Robux = (Game Pass + Developer Product) × 70% + Premium Payout
Daily USD = Daily net Robux ÷ 285.71
Roblox takes a 30% marketplace fee on game pass and developer product sales — creators keep 70%. Premium Payouts are distributed separately from a subscription revenue pool and aren’t subject to that fee, since no marketplace transaction occurs. The built-in conversion uses Roblox’s Developer Exchange (DevEx) rate of 285.71 Robux per $1 USD.
Conversion Rate Benchmarks by Genre
Conversion rate — the percentage of daily visitors who make at least one purchase — is the single highest-leverage number in this formula, and it varies enormously by genre because different game loops create different purchase triggers:
| Genre | Average | Good | Great | Key driver |
|---|---|---|---|---|
| Simulator | 4.0% | 7.0% | 12.0% | Progression gates & rebirth loops |
| Tycoon | 3.0% | 5.5% | 9.0% | Speed-up passes & VIP servers |
| RPG | 2.5% | 4.5% | 8.0% | Cosmetics & power passes at update launches |
| Roleplay | 2.0% | 3.5% | 6.0% | VIP server passes (449–999 R$) |
| FPS / Shooter | 1.5% | 2.8% | 5.0% | Cosmetics & battle pass equivalents |
| Horror | 1.2% | 2.2% | 4.0% | New-release spikes, morph packs |
| Obby | 0.8% | 1.5% | 3.0% | Skip-stage passes (75–149 R$) |
Simulators sit at the top because incremental progression loops naturally gate content behind purchases, and rebirth or prestige systems sustain repeat spending long after the initial session. Obbies sit at the bottom because skipping a hard stage is a much narrower purchase trigger than an entire progression system — even though obby games frequently rack up far higher raw visit counts than simulators do.
A Full Worked Example
Take a Simulator game at its genre-average conversion rate: 50,000 daily visits, 4.0% conversion, a 199 Robux average game pass bought by 50% of paying users, a 79 Robux developer product bought 1.5 times per paying user per day, 15% Premium visitors (the platform average), and a 30-minute average session:
| Step | Calculation | Result |
|---|---|---|
| Paying users | 50,000 × 4.0% | 2,000 |
| Game pass buyers | 2,000 × 50% | 1,000 |
| Game pass Robux | 1,000 × 199 R$ | 199,000 R$ |
| Developer product Robux | 2,000 × 1.5 × 79 R$ | 237,000 R$ |
| Premium visitors | 50,000 × 15% | 7,500 |
| Premium Payout Robux | 7,500 × 30 min × 0.007 R$ | 1,575 R$ |
| Daily gross | 199,000 + 237,000 + 1,575 | 437,575 R$ |
| Daily net | (199,000 + 237,000) × 70% + 1,575 | 306,775 R$ |
| Monthly net | 306,775 × 30 | 9,203,250 R$ |
| Monthly USD | 9,203,250 ÷ 285.71 | ≈$32,212 |
In this example, developer products (54.2% of gross) actually out-earn game passes (45.5%) despite the lower individual price, because they scale with every purchase a returning player makes rather than capping at one sale per player. Premium Payouts contribute a comparatively tiny 0.4% of gross here — that’s expected at a 30-minute session length, and it grows significantly with longer average sessions.
Same Traffic, Different Genre: The Revenue Gap
Run that exact same game pass and developer product setup through an Obby’s average 0.8% conversion rate instead of a Simulator’s 4.0%, holding the 50,000 daily visits constant, and the outcome changes dramatically — while the Premium Payout figure stays identical, because it depends on total visits and session length, not on conversion rate at all:
| Metric | Simulator (4.0%) | Obby (0.8%) |
|---|---|---|
| Paying users/day | 2,000 | 400 |
| Monthly net Robux | 9,203,250 | 1,878,450 |
| Monthly USD | ≈$32,212 | ≈$6,576 |
| Earnings tier | Top Earner | Full-Time |
Same 50,000 visits, same pricing decisions, a 4.9x revenue gap — entirely attributable to how the genre’s core loop creates (or fails to create) a purchase trigger.
Premium Payouts Don’t Care About Your Monetization Design
Because Premium Payout Robux is calculated from Premium visitors × session minutes × 0.007, it’s the one revenue source in this model that’s completely decoupled from game pass pricing, developer product design, or conversion rate. It rewards raw engagement time from Premium subscribers regardless of whether they ever spend a Robux. Roblox does not publish the exact per-minute rate — 0.007 R$/minute is a conservative estimate derived from DevForum postmortems and community analytics, not an official figure, so treat it as directional rather than exact.
Earnings Tiers
| Tier | Monthly USD floor |
|---|---|
| Hobby | $0 |
| Side Income | $50 |
| Part-Time | $500 |
| Full-Time | $2,000 |
| Top Earner | $10,000 |
How to Use the Roblox Game Revenue Estimator
- Open the Roblox Game Revenue Estimator.
- Pull your daily visits and Premium visitor percentage from your Creator Dashboard, and select your game’s genre.
- Enter your average game pass price and what share of paying users buy one.
- Enter your average developer product price and purchases per paying user per day.
- Set your average session length, then read your daily/monthly revenue, per-source breakdown, earnings tier, and conversion-rate rating against your genre’s benchmark.
Related Calculators
Convert any Robux figure to USD directly with the Robux Calculator, check margins on avatar item sales with the UGC Profit Margin Calculator, and compare against a different platform’s creator economy with the Fortnite Payout Calculator. Estimate how long it takes a player to reach your monetization gates with the XP Grind Timer, understand where your game’s luck-based drop rates sit with the Luck Percentile Calculator, and split revenue fairly with collaborators using the Revenue Split Calculator.
Frequently Asked Questions
Why does conversion rate matter more than daily visits?
Conversion rate multiplies across every purchase-based revenue source at once — doubling it from 2% to 4% doubles both game pass buyers and developer product volume simultaneously. Doubling daily visits achieves a similar effect but requires far more effort, since traffic growth depends on Roblox’s discovery algorithm, search ranking, and external marketing. For a game already live, improving conversion is usually the faster lever to pull.
Is the Developer Exchange rate used here still current?
This calculator uses Roblox’s 285.71 Robux-per-dollar figure from 2024 documentation. Roblox’s published standard DevEx rate has since moved to $0.0038 per Robux (about 263.16 Robux per dollar) as of September 2025, so real-world USD payouts today run somewhat higher than this tool’s estimate. Use the Robux Calculator for the most current conversion, and always confirm against your actual Creator Dashboard payout.
Do developer products really out-earn game passes for most games?
It depends heavily on purchase frequency — a game pass sells once per player at any price, while a developer product can be bought repeatedly by the same engaged player. In the worked example above, developer products contributed 54% of gross revenue versus 45% for game passes, purely because purchases-per-user was set above 1. A game with a single high-value pass and no repeatable purchases would see the opposite split.
Why doesn’t Premium Payout change when I raise my conversion rate?
Premium Payout is calculated purely from Premium subscriber visit count and session length — it has no dependency on game pass price, purchase rate, or developer product design in this model. It’s Roblox rewarding engagement time from its own subscription pool, not a cut of your marketplace sales. That’s why it stayed fixed at 1,575 Robux in both the Simulator and Obby comparison above despite the conversion rate changing by 5x.
What’s the fastest way to move from “Average” to “Good” conversion?
For most genres, adding or repricing a low-friction starter game pass (typically 75–199 Robux) is the highest-leverage single change, since it converts casual browsers before they decide the game isn’t worth further attention. A/B testing your game’s thumbnail and icon alongside pass pricing compounds the effect, since discovery click-through and monetization conversion reinforce each other.
Genre sets the ceiling on conversion rate, but pricing, purchase frequency, and Premium engagement are what determine how close to that ceiling any specific game actually lands.
External Resources
- Developer Exchange Help and Information Page — Roblox’s official current DevEx rates and eligibility requirements
- Marketplace Fees and Commissions — Roblox Creator Hub’s official breakdown of the 30% marketplace fee structure