PC Power Consumption Calculator: Why Checking Idle Costs Can Wreck Your PSU Recommendation
Switch this calculator to Idle mode just to check standby costs, and its PSU recommendation for the exact same build silently drops from 1000W to 400W. Here's why, and the real math behind PSU efficiency loss.
PC Power Consumption Calculator: Why Checking Idle Costs Can Wreck Your PSU Recommendation
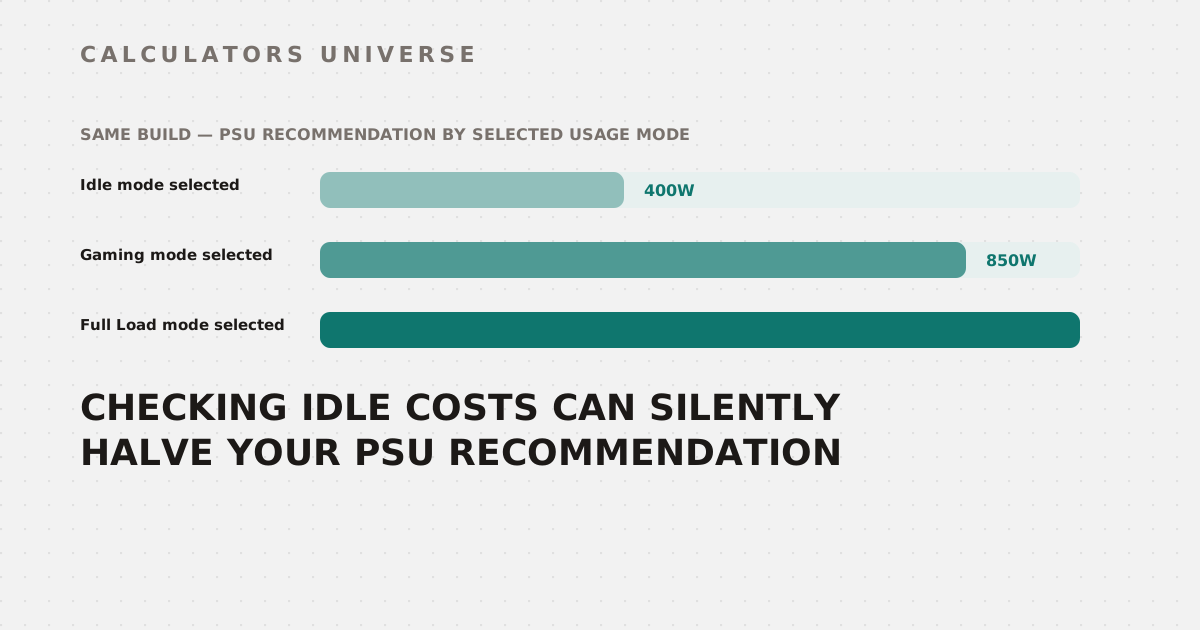
Set the exact same build in the PC Power Consumption & Electricity Cost Calculator to Full Load mode, and it recommends a 1000W power supply. Switch nothing except the usage mode to Idle — just to glance at standby electricity cost — and the same page’s PSU recommendation quietly drops to 400W, the tool’s absolute floor. Nothing about the hardware changed; only which usage mode happened to be selected when the recommendation was calculated. Here’s exactly why that happens, and the real cost math for PSU efficiency underneath it.
How the Calculator Builds Every Component’s Wattage
Every component’s power draw is calculated with linear interpolation between its idle wattage and its full-load TDP, scaled by a load factor tied to the selected usage mode:
Component watts = Idle watts + (TDP − Idle watts) × Load Factor

Load Factor:  Idle = 0.10   Gaming = 0.85   Full Load = 1.00
This applies uniformly to the CPU, GPU, RAM, storage, fans, and even the fixed motherboard/USB overhead — every single category scales off the same selected mode.
Where the PSU Recommendation Actually Comes From
The recommended PSU size is 1.25 × your component draw at the currently selected usage mode, rounded to the nearest 50W, with a 400W floor. That “currently selected usage mode” detail is the trap: the recommendation isn’t based on your build’s full-load ceiling by default — it’s based on whichever mode happens to be selected on screen right now.
For a Core i9-14900K + RTX 4090 build (32GB RAM, 2 NVMe drives, 5 case fans, AIO cooler), switching only the usage mode produces three completely different PSU recommendations:
| Selected usage mode | Component draw (approx.) | PSU recommendation |
|---|---|---|
| Idle | ~153W | 400W (floor) |
| Gaming | ~697W | 850W |
| Full Load | ~800W | 1000W |
A PSU sized off the Idle-mode reading would be catastrophically undersized the moment that same PC actually starts gaming or renders a heavy workload. The fix is simple once you know about it: always read the PSU recommendation while the mode selector is on Gaming or Full Load, never Idle — Idle mode is only useful for checking standby electricity cost, not for sizing a power supply.
The Real Cost of PSU Efficiency Loss
PSU efficiency isn’t charged as a flat percentage on your bill — it’s applied directly to the wattage pulled from the wall for the exact same component draw:
Wall draw = Component draw ÷ PSU efficiency
Take a fixed 500W of actual component draw and run it through two different PSU efficiency ratings:
| PSU tier | Efficiency | Wall draw for 500W of components |
|---|---|---|
| 80 Plus Bronze | 85% | 588.2W |
| 80 Plus Titanium | 94% | 531.9W |
That’s 56.3W of pure waste heat, eliminated for the identical component load, purely by the PSU’s conversion efficiency. It isn’t a one-time cost — it’s an extra 56W pulled from the wall every single hour the system draws that 500W, for as long as the PSU is installed.
A Full Annual Cost Comparison
Running the same i9-14900K + RTX 4090 gaming build (8 hours/day at $0.15/kWh) through Bronze versus Titanium PSU tiers:
| PSU tier | Total wall draw | Annual electricity cost |
|---|---|---|
| 80 Plus Bronze | 850.1W | $372.61 |
| 80 Plus Titanium | 771.6W | $338.19 |
The efficiency upgrade alone saves $34.42 per year on this specific build — money that compounds for as long as the PSU stays installed, from a component list that never changed.
How to Use the PC Power Consumption Calculator
- Open the PC Power Consumption & Electricity Cost Calculator.
- Select your exact CPU and GPU, RAM, storage, fans, and monitor wattage.
- Set your usage mode to Gaming or Full Load before reading the PSU recommendation — reserve Idle mode strictly for checking standby cost.
- Enter your PSU’s efficiency tier and your local electricity rate to get accurate daily, monthly, and yearly cost projections.
- Compare PSU efficiency tiers at the same component load to see the real annual cost difference an upgrade would save.
Related Calculators
Cross-check the minimum PSU wattage for your exact component combination with the PSU Wattage Calculator, and confirm your CPU isn’t bottlenecking your GPU with the CPU & GPU Bottleneck Calculator. Estimate real in-game FPS for your GPU with the GPU FPS Estimator, size the right cooler for your CPU’s real heat output with the CPU & GPU Thermal TDP Calculator, plan your full build budget with the PC Build Budget Planner, and check your GPU’s VRAM needs with the VRAM Requirement Calculator. For the broader gaming-specific cost picture, see How Much Electricity Does Your Gaming PC Really Use?
Frequently Asked Questions
Why did my PSU recommendation change when I only switched the usage mode?
The recommendation is calculated as 1.25× your component draw at whichever usage mode is currently selected, not your build’s full-load ceiling by default. Idle mode scales every component down to roughly 10% of the gap between its idle and full-load wattage, which produces a much smaller — and unsafe to actually shop from — PSU recommendation.
Which usage mode should I trust for sizing a real PSU purchase?
Full Load, or at minimum Gaming mode if your build genuinely never sustains an all-core, all-VRAM workload. Idle mode exists to answer “what does my PC cost to leave running at the desktop,” not “what PSU do I need” — treat its PSU recommendation as informational only, never as a shopping number.
Does PSU efficiency loss show up as heat or as extra electricity cost?
Both — the energy an inefficient PSU fails to deliver to your components as usable DC power is dissipated as heat inside the PSU itself, but you still paid for that wasted energy at the wall meter. A Bronze-rated PSU converting 500W of component draw pulls 588W from the wall; the 88W difference between that and a same-load Titanium unit (532W) is heat your electricity bill paid for and your case fans have to help exhaust.
Does the load factor apply the same way to every component?
Yes — CPU, GPU, RAM, storage, fans, and the fixed motherboard/USB overhead all interpolate between their own idle and full-load figures using the identical load factor for whichever usage mode is selected (10% for Idle, 85% for Gaming, 100% for Full Load). No component gets a different scaling curve based on its type.
Is the monitor’s wattage subject to PSU efficiency loss too?
No — the calculator treats monitor wattage as a separate wall draw, added after the PSU efficiency division rather than before it. That’s accurate to how a monitor is actually wired: it plugs into the wall directly (or through a separate power brick) rather than drawing through the PC’s own power supply, so it never picks up the PSU’s conversion loss the way CPU, GPU, and other internal components do.
The PSU recommendation on this calculator answers “what do you need for the mode you currently have selected,” not “what do you need for this PC” — checking it while the page happens to be set to Idle is the single easiest way to walk away with a dangerously wrong number.
External Resources
- U.S. EIA Electricity Rates — official residential average electricity rates by state
- 80 Plus Certification Database — verified PSU efficiency ratings by certification tier