CPU Benchmark Comparison: Why Two CPUs Can Tie in Gaming But Split 16% on Everything Else
The Ryzen 9 9950X and Core i9-14900K post a 1% gaming tie but a real 16% multi-core gap and a $250 price difference. The exact decision logic behind the comparison.
CPU Benchmark Comparison: Why Two CPUs Can Tie in Gaming But Split 16% on Everything Else
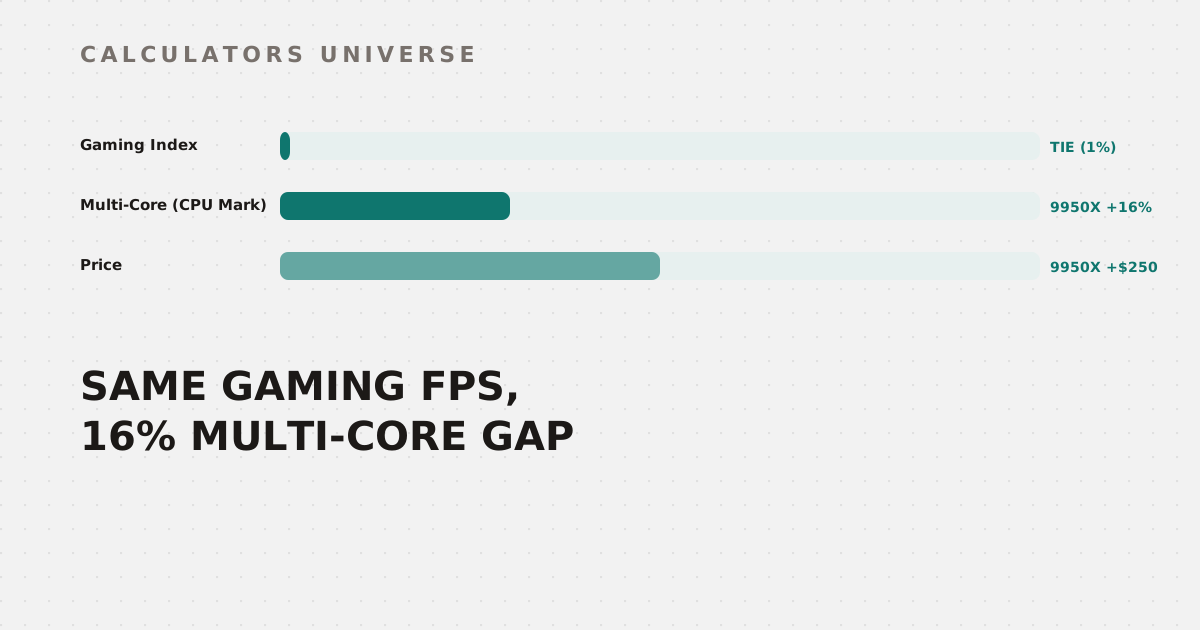
The Ryzen 9 9950X and Core i9-14900K land within 1% of each other on gaming performance — effectively a tie. Multi-core performance is a different story: a real 16% gap, with the 9950X ahead, alongside a $250 higher price tag and 83 fewer watts of power draw. Three numbers, three different verdicts, all from the same two CPUs. The CPU Benchmark Comparison Tool is built to surface exactly that kind of split rather than collapse it into a single misleading “winner,” so here’s the decision logic underneath it.
What Goes Into a CPU Benchmark Comparison?
This tool scores every CPU on four independent metrics, because no single number captures performance across every workload:
- PassMark Single Thread Rating — one core’s speed, the number gaming performance tracks most closely
- PassMark CPU Mark (multi-core) — total throughput across every core, the number rendering and compiling track
- Cinebench R24 — a vendor-neutral rendering benchmark, the multi-core standard used across the PC press
- Gaming Index — average FPS across 10 CPU-sensitive titles at 1080p Ultra with an RTX 4090 (eliminating GPU bottleneck), indexed to the Core i9-13900K at 100
A fifth number, value score, is derived rather than benchmarked directly: PassMark Multi ÷ Price. Higher means more raw multi-core throughput per dollar spent.
The Verdict Decision Tree
Rather than averaging all four metrics into one score, the comparison runs a fixed priority order — the first condition that matches produces the final verdict sentence, even if a CPU is winning other categories:
| Priority | Condition | Verdict produced |
|---|---|---|
| 1 | All of single/multi/gaming within 2%, price gap over $30 | The cheaper CPU wins outright |
| 2 | Gaming index gap over 5% AND single-core gap over 3% | The faster one is named the better gaming CPU |
| 3 | Multi-core gap over 15% | The leader is named the better content-creation CPU |
| 4 | Value score gap over 20% | The better value CPU is named the smarter pick |
| 5 | None of the above | Verdict defers to platform/motherboard cost as the tiebreaker |
Each individual category (single-core, multi-core, gaming, Cinebench, TDP, price, value) also gets its own winner badge using its own threshold — a 2% gap decides single/multi/gaming/Cinebench, a 5W gap decides TDP, a $10 gap decides price, and a 5% ratio gap decides value. That separation matters: a CPU can win the individual multi-core and value badges and still lose the one-sentence verdict, if the gaming-performance priority tier triggers first.
Worked Example: Ryzen 9 9950X vs. Core i9-14900K
| Metric | Ryzen 9 9950X | Core i9-14900K | Gap | Category winner |
|---|---|---|---|---|
| PassMark Single | 4,950 | 4,500 | +10% | 9950X |
| PassMark Multi | 73,000 | 63,000 | +16% | 9950X |
| Gaming Index | 104 | 103 | +1% | Tie |
| Cinebench R24 | 3,550 | 3,300 | +8% | 9950X |
| TDP | 170W | 253W | −83W | 9950X (cooler) |
| Price | $649 | $399 | +$250 | 14900K (cheaper) |
| Value score | 112.5 | 157.9 | −29% | 14900K |
Because the gaming gap (1%) doesn’t clear the 5% priority-1 threshold, and the multi-core gap (16%) does clear the 15% priority-3 threshold, the tool’s one-sentence verdict lands on: “For multi-threaded workloads like video rendering and code compilation, Ryzen 9 9950X leads by 16% — worth the premium if you do heavy content creation.” Note what that verdict doesn’t say: the 14900K actually wins the value-score badge by a wide margin, at 157.9 versus 112.5. Both things are true at once — the 9950X is the correct pick for a rendering workload, and the 14900K is the correct pick for a value-focused build with the same gaming performance either way.
Worked Example: Core i5-14400 vs. Ryzen 5 7600
Same price, same TDP, different result. Both chips sell for $179 and carry a 65W rating:
| Metric | Core i5-14400 | Ryzen 5 7600 | Gap | Category winner |
|---|---|---|---|---|
| PassMark Single | 3,500 | 3,680 | −5% | Ryzen 5 7600 |
| PassMark Multi | 23,500 | 20,500 | +15% | i5-14400 |
| Gaming Index | 91 | 97 | −6% | Ryzen 5 7600 |
| Cinebench R24 | 1,300 | 1,400 | −7% | Ryzen 5 7600 |
| Value score | 131.3 | 114.5 | +15% | i5-14400 |
Here the gaming gap (−6%) and single-core gap (−5%) both clear their priority-2 thresholds, so the verdict resolves before the multi-core or value tiers are ever checked: “Ryzen 5 7600 is the better gaming CPU — 5% faster in single-core performance that drives frame rates and 1% lows.” The i5-14400 genuinely wins two badges here — 15% more multi-core throughput and 15% better value-per-dollar — but at identical price and power, the priority order puts gaming ahead of both, because that’s the workload most people comparing a $179 CPU are actually asking about.
Which CPUs Deliver the Most Multi-Core Per Dollar
Ranking every CPU in this dataset by value score alone surfaces a genuinely counterintuitive result:
| CPU | Price | Value score (Multi ÷ Price) |
|---|---|---|
| Core i9-14900K | $399 | 157.9 |
| Core i7-14700K | $359 | 147.6 |
| Core i5-14400 | $179 | 131.3 |
| Core i5-14600K | $279 | 129.0 |
| Ryzen 9 9900X | $449 | 127.0 |
| Ryzen 5 7600 | $179 | 114.5 |
| Ryzen 9 9950X | $649 | 112.5 |
| Ryzen 7 9700X | $329 | 106.4 |
| Core i3-14100 | $134 | 100.8 |
| Ryzen 5 9600X | $279 | 87.8 |
| Core Ultra 7 265K | $394 | 83.8 |
| Core Ultra 9 285K | $589 | 69.6 |
The $399 Core i9-14900K posts the single highest multi-core-per-dollar score in the entire list — beating every CPU priced under it, including budget chips like the i3-14100. That’s a direct result of Raptor Lake Refresh packing 24 cores/32 threads at a price close to mid-range parts. Arrow Lake sits at the opposite end: the Core Ultra 9 285K, at $589, posts the lowest value score here despite being Intel’s newest flagship, because its multi-core throughput doesn’t scale with its price the way Raptor Lake Refresh’s does.
How to Use the CPU Benchmark Comparison Tool
- Open the CPU Benchmark Comparison Tool.
- Select two CPUs from the Intel and AMD dropdowns, or load one of the built-in preset pairs.
- Read the per-category winner badges for single-core, multi-core, gaming, Cinebench, TDP, price, and value.
- Read the one-sentence verdict, and check it against the individual badges — a CPU can win several categories and still lose the top-line verdict if a higher-priority gap (like gaming) resolves first.
Related Calculators
Check whether your CPU or GPU is actually the bottleneck in your build with the CPU & GPU Bottleneck Calculator, find the right cooler for a CPU’s real power draw with the CPU & GPU Thermal TDP Calculator, and calculate the real electricity cost of running it with the PC Power Consumption Calculator. Estimate in-game FPS for a specific GPU and game with the GPU FPS Estimator, allocate your full build budget with the PC Build Budget Planner, and size your power supply correctly with the PSU Wattage Calculator.
Frequently Asked Questions
Why does the tool’s verdict sometimes ignore the multi-core or value winner?
Because the verdict runs a fixed priority order, not an average of every category. If the gaming-performance gap clears its threshold first, the verdict resolves around gaming even when the losing CPU wins the multi-core or value badges by a wide margin. The individual category badges still show the full picture — the one-sentence verdict is a simplification for whichever workload the priority order judges most decision-relevant.
Is PassMark Multi score a good predictor of gaming FPS?
Not on its own — PassMark Multi rewards total core-count throughput, which correlates with rendering and compiling speed far more than with gaming frame rates. Most game engines are bottlenecked by a handful of fast threads, which is why the Gaming Index and PassMark Single Thread score are the more relevant metrics for a gaming-focused comparison.
Why does a $250 cheaper CPU sometimes still lose the verdict?
Price only decides the verdict directly in priority tier 1, which requires all three of single-core, multi-core, and gaming to already be within 2% of each other. Once any of those gaps is large enough to trigger a higher-priority tier — like the 16% multi-core gap between the 9950X and 14900K — price becomes a secondary consideration mentioned in context, not the deciding factor.
What does a “tie” actually mean in the gaming category?
A gaming tie means the two CPUs’ Gaming Index values are within 2% of each other — close enough that the difference is unlikely to be perceptible in actual gameplay, especially once GPU-bound resolutions like 1440p or 4K are factored in. A 1% gap, like the one between the 9950X and 14900K here, is well inside normal benchmark-run variance.
Should I trust the value score over the gaming or multi-core numbers?
It depends entirely on your workload — value score answers “how much multi-core throughput do I get per dollar,” which matters for rendering, compiling, and other heavily-threaded tasks, but says nothing about single-core-bound gaming performance. A CPU with an excellent value score can still be a poor gaming pick if its single-core and Gaming Index numbers lag behind a pricier alternative.
Two CPUs “tying” on one metric and splitting by double digits on another isn’t a contradiction — it’s the normal result of comparing chips built around different priorities, and the only way to read that correctly is to check the category that actually matches your workload instead of the single verdict sentence alone.
External Resources
- PassMark CPU Benchmark Charts — full database of PassMark single-thread and multi-thread scores
- Nano Review CPU Ratings — multi-source benchmark aggregation used for cross-checking Cinebench scores