Apple Silicon vs PC: Why 6 of 7 Workloads Tie and Coding Doesn't
An M4 Pro Mac and a similarly-priced Ryzen 7800X3D + RTX 4080 PC tie within 3% on six of seven workloads. Coding is the exception — and the reason is entirely in the weighting math.
Apple Silicon vs PC: Why 6 of 7 Workloads Tie and Coding Doesn’t
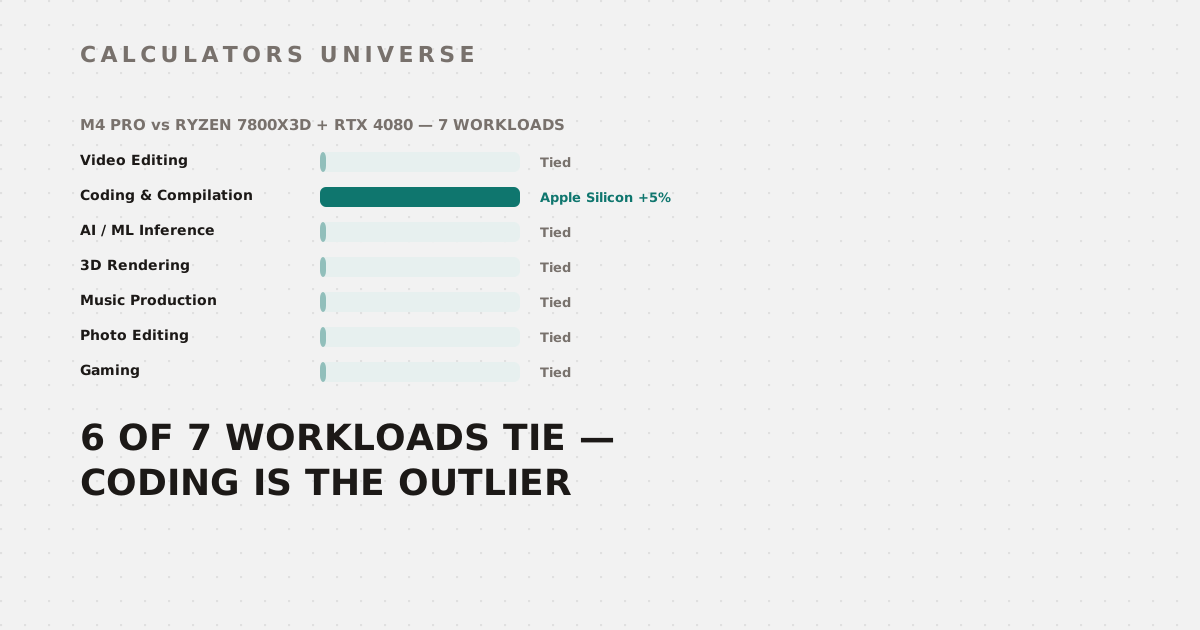
Run a $1,999 Apple M4 Pro against a similarly-priced AMD Ryzen 7 7800X3D + RTX 4080 PC across every workload profile in the Apple Silicon vs PC Performance Comparison, and six of the seven land inside the tool’s own 3% “essentially tied” threshold. The one exception is Coding & Compilation, where Apple Silicon comes out 5% ahead — a real, if modest, win. Neither the tie nor the exception is a coincidence; both come directly out of how the tool weights five hardware categories differently per workload. Here’s the exact math.
The Five Categories Behind Every Score
Every chip and PC build gets scored on the same five categories, then a workload profile decides how much each one counts:
| Category | M4 Pro | Ryzen 7 7800X3D + RTX 4080 |
|---|---|---|
| CPU | 85 | 78 |
| GPU | 80 | 85 |
| Memory Bandwidth | 50 | 64 |
| Neural / AI | 90 | 72 |
| Power Efficiency | 45 | 28 |
Memory Bandwidth and Neural/AI aren’t measured the same way for both platforms. The Mac’s memory score comes from its chip’s actual unified memory bandwidth spec (273 GB/s here, scaled against a 546 GB/s reference). The PC’s memory score is a proxy based purely on RAM capacity (RAM in GB × 2, capped at 100) — a stand-in for DDR bandwidth, not a real bandwidth measurement. Neural/AI for the PC is derived from whichever of CPU or GPU scores higher, multiplied by 0.85, since there’s no dedicated NPU baseline to measure against Apple’s Neural Engine.
Six Workloads, One Pattern
Each workload profile applies its own weights to those five categories. Running the numbers for this specific pairing:
| Workload | Mac weighted score | PC weighted score | Gap | Result |
|---|---|---|---|---|
| Video Editing | 70.75 | 71.65 | 0.9 | Tied |
| Coding & Compilation | 71.75 | 68.10 | 3.65 | Apple Silicon +5% |
| AI / ML Inference | 75.50 | 73.65 | 1.85 | Tied |
| 3D Rendering | 73.50 | 74.05 | 0.55 | Tied |
| Music Production | 68.25 | 66.70 | 1.55 | Tied |
| Photo Editing | 69.50 | 70.25 | 0.75 | Tied |
| Gaming | 72.75 | 72.95 | 0.2 | Tied |
The tool only declares a winner once the weighted gap exceeds 3 points — everything under that is reported as “essentially tied.” For two competitively specced, similarly priced machines, most workload weightings simply don’t push the gap past that line. Coding is the exception because it weights CPU most heavily (50%) and Power Efficiency second (15%) — the two categories where this particular Mac holds its largest relative leads (85 vs. 78, and 45 vs. 28) — while barely counting GPU (10%), the PC’s strongest category.
The Coding Result, Fully Worked
Coding & Compilation weights CPU at 0.50, GPU at 0.10, Memory at 0.20, Neural at 0.05, and Efficiency at 0.15:
Mac:  85(0.50) + 80(0.10) + 50(0.20) + 90(0.05) + 45(0.15) = 71.75
PC:   78(0.50) + 85(0.10) + 64(0.20) + 72(0.05) + 28(0.15) = 68.10
That 3.65-point gap clears the 3-point threshold, so the tool declares Apple Silicon the winner by 5% — (71.75 − 68.10) ÷ 68.10 × 100. Converted into a reference task (“compile a large multi-module project,” modeled at 120 seconds for the winner), the Mac finishes in 120 seconds against the PC’s 126 seconds. A real gap, but a 6-second one on a two-minute compile — not the kind of difference that would be obvious without the tool doing the arithmetic.
Winning Performance Doesn’t Mean Winning Value
Here’s where the story gets more interesting: even though the Mac wins the Coding workload outright, it loses badly on performance-per-dollar. At this RAM configuration (48GB Mac, 32GB PC):
| Price | Coding display score | Perf-per-dollar | |
|---|---|---|---|
| M4 Pro | $2,599 | 100 | 0.0385 |
| Ryzen 7800X3D + RTX 4080 | $1,720 | 95 | 0.0552 |
The PC delivers 43% more performance per dollar spent despite scoring 5 points lower in raw coding performance, purely because it costs 34% less. Value and performance are computed as two separate outputs for a reason — a workload winner and a value winner can legitimately be different platforms in the very same comparison.
The Power Gap Holds Even When the Mac “Loses”
Across every workload in this pairing, the PC draws roughly 490W under load (170W CPU + 320W GPU + a 50W baseline) against the Mac’s fixed 55W chip power draw — an 89% efficiency gap that doesn’t move regardless of which platform wins the performance category that workload. Even in Video Editing and Gaming, where the PC edges ahead on raw score, it’s doing so while drawing nine times the power.
RAM Means Something Different on Each Side
One asymmetry worth knowing before reading results: increasing RAM on the Mac side changes its price but not a single performance category score — the memory bandwidth figure comes from the chip’s fixed spec, independent of how much unified memory you configure. On the PC side, memory score scales directly with RAM capacity (GB × 2, capped at 100). Practically, more Mac RAM buys headroom for larger projects and models, not a higher benchmark number in this tool; more PC RAM raises the modeled score directly.
How to Use the Apple Silicon vs PC Comparison Tool
- Open the Apple Silicon vs PC Performance Comparison.
- Select your workload — this sets the category weights that decide the result.
- Choose an Apple Silicon chip and RAM configuration, then a PC CPU, GPU, and RAM configuration.
- Compare the weighted scores, estimated task time, price, and the separate value-per-dollar verdict — check whether the workload winner and the value winner actually agree before deciding.
Related Calculators
Compare raw CPU specs head-to-head with the CPU Benchmark Comparison Tool, and rank GPUs by frames or score per dollar with the GPU Price-to-Performance Calculator. Estimate real electricity cost for a PC build with the PC Power Consumption Calculator, check how much memory a local AI model actually needs with the LLM VRAM Calculator, decide between a workstation and gaming GPU with the Workstation vs Gaming PC Calculator, and compare DDR4 vs DDR5 kits by real latency with the RAM Latency Calculator.
Frequently Asked Questions
Why do most workloads come back “tied” instead of picking a clear winner?
The tool only declares a winner once the weighted score gap exceeds 3 points, and for two similarly priced, competitively specced machines, most workload weightings simply don’t produce a gap that large. A tie isn’t a limitation of the tool — it’s an accurate reflection that two well-matched machines really do perform close enough that the difference wouldn’t be noticeable in daily use.
If the Mac wins Coding, why does the PC win value for the same workload?
Performance and price-per-performance are two independently computed outputs, and there’s no rule forcing them to agree. The Mac’s 5% performance lead in Coding comes from a $2,599 machine; the PC achieves 95% of that performance for $1,720, which is enough of a price gap to flip the value verdict even though the raw performance verdict goes the other way.
Does adding more RAM to a Mac configuration improve its score in this tool?
No — the Mac’s Memory Bandwidth category score comes from the chip’s fixed unified memory bandwidth specification, which doesn’t change based on how much RAM you configure. Selecting more RAM increases the calculated price but leaves every performance category score exactly the same; it only matters for fitting larger projects or models in practice, not for this tool’s scoring.
Is the Neural / AI score fair to PC builds that have no dedicated AI hardware?
It’s an intentional proxy rather than a direct measurement — since PCs in this comparison have no NPU baseline comparable to Apple’s Neural Engine, the tool estimates PC Neural/AI capability as 85% of whichever of CPU or GPU scores higher. That approximates real-world behavior reasonably well for inference workloads that fall back to CPU or GPU compute, but it isn’t measuring a dedicated AI accelerator the way the Mac’s score is.
Why does the power efficiency gap stay so large even in workloads the PC wins?
Power draw is calculated independently of which platform wins the performance category — the PC’s wattage is the sum of its CPU TDP, GPU load power, and a fixed 50W system baseline, while the Mac uses the chip’s fixed load power figure. A workload weighting can easily favor the PC’s higher raw GPU or CPU score while completely ignoring the Efficiency category, which is exactly what happens in Gaming and Video Editing here.
Two competitively priced machines rarely differ as dramatically as marketing or forum arguments suggest — the real story in a workload-weighted comparison is usually which one or two categories a specific task actually leans on, not a single “which platform is better” verdict.
External Resources
- Apple Mac — official specifications for M-series chips and Mac configurations
- NVIDIA GeForce — official GPU specs, power requirements, and driver details