Standard Deviation vs Variance vs Z-Score: How Statisticians Actually Measure Spread
Variance, standard deviation, and z-score all measure spread, but they answer different questions. The real formulas, why n-1 matters, and what a z-score means.
Standard Deviation vs Variance vs Z-Score: How Spread Actually Gets Measured
“Spread” in a dataset gets measured by three related numbers, and they’re not interchangeable — each answers a genuinely different question. Mixing them up is one of the most common mistakes in applied statistics, so here’s exactly what each one calculates, and why the formulas are built the way they are.
Variance: The Foundational Measure
Variance quantifies, on average, how far each data point sits from the mean — squared, so that positive and negative deviations don’t cancel out. There are two versions, and the difference matters:
- Population variance: σ² = Σ(x − μ)² / N
- Sample variance: s² = Σ(x − x̄)² / (n − 1)
Notice the sample formula divides by n − 1, not n. That’s not an arbitrary convention — it’s called Bessel’s correction, and it exists for a precise reason.
Why n − 1? Bessel’s Correction Explained
The sample mean (x̄) is calculated from the same data you’re measuring variance against, and it always sits exactly at the center of that specific sample — closer to those points, on average, than the true (unknown) population mean would be. That makes the squared deviations calculated against the sample mean systematically a little too small, which would bias the variance estimate downward if you divided by n. Dividing by n − 1 corrects that bias.
The degrees-of-freedom framing explains it more directly: you’re estimating two things — the mean and the variance — from the same n data points. One degree of freedom gets “used up” calculating the mean, leaving n − 1 degrees of freedom for estimating variance. Worth noting honestly: while n − 1 makes the estimator unbiased, it doesn’t actually minimize mean squared error — a real, if secondary, statistical subtlety. Compute both versions directly, with the full derivation shown, using the Variance Calculator.
Standard Deviation: Variance, Back in the Original Units
Variance is expressed in squared units — if your data is in dollars, variance comes out in dollars². That’s mathematically necessary but practically unintuitive, which is exactly why standard deviation (σ = √variance) exists: it converts spread back into the original units, making it directly comparable to the data itself. Get sample and population standard deviation, variance, mean, median, and range all at once with the Standard Deviation Calculator.
The Empirical Rule: Turning Standard Deviation Into Real Percentages
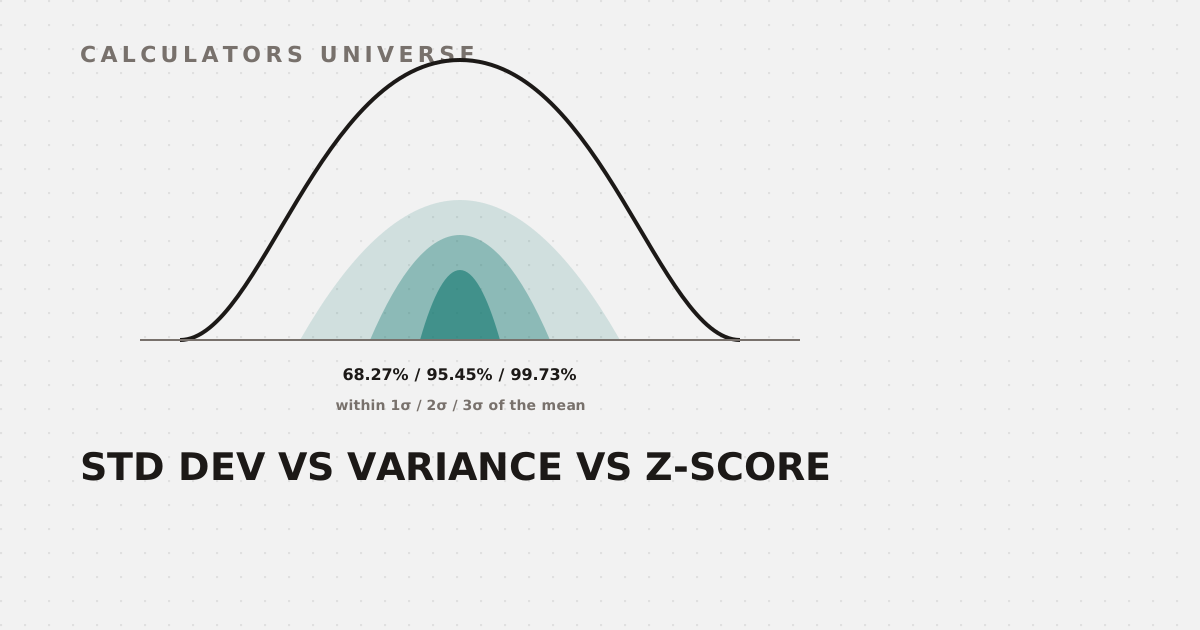
For data that’s normally distributed, standard deviation translates into precise, predictable percentages — the 68-95-99.7 rule:
The precise figures are 68.27%, 95.45%, and 99.73% — commonly rounded to 68/95/99.7
Approximately 68.27% of values fall within one standard deviation of the mean, 95.45% within two, and 99.73% within three. See the exact boundary values and a shaded bell curve for your own mean and standard deviation with the Empirical Rule Calculator, or work with exact probabilities for any cutoff — not just whole standard deviations — using the Normal Distribution Calculator.
Z-Score: Locating One Specific Point on That Curve
A z-score standardizes any single raw value against the mean and standard deviation: z = (x − μ) / σ. It answers “how many standard deviations away from the mean is this one specific point?” — which is exactly what turns a raw score into a percentile rank or a tail probability. Calculate a z-score, its percentile, and left/right/two-tailed probabilities with the Z-Score Calculator.
Coefficient of Variation: Comparing Spread Across Different Units
Standard deviation alone can’t be meaningfully compared between datasets measured in different units or wildly different scales — a standard deviation of 5 means something very different for a dataset of prices in dollars than one of weights in kilograms. The coefficient of variation, CV = (σ / μ) × 100%, expresses spread as a percentage of the mean, making relative variability directly comparable across otherwise incompatible datasets. Calculate and compare CV for one or two datasets — from raw data or summary statistics — with the Coefficient of Variation Calculator.
Frequently Asked Questions
What’s the actual difference between variance and standard deviation?
Variance is the average of squared deviations from the mean, expressed in squared units; standard deviation is its square root, expressed in the data’s original units — which is why standard deviation is usually the more intuitive number to report.
Why does sample variance divide by n − 1 instead of n?
Because the sample mean is calculated from the same data, it’s systematically closer to that data than the true population mean would be, which biases the naive variance estimate downward — dividing by n − 1 (Bessel’s correction) removes that bias.
What does a z-score of 2 actually mean?
It means the value sits exactly two standard deviations above the mean — under a normal distribution, that corresponds to roughly the 97.7th percentile.
Does the empirical rule (68-95-99.7) apply to any dataset?
No — it specifically assumes a normal (bell-curve) distribution. Skewed or heavy-tailed data can deviate substantially from these percentages even with the same mean and standard deviation.
When should I use coefficient of variation instead of standard deviation?
Whenever you need to compare relative variability across datasets with different units or very different means — CV normalizes for scale in a way raw standard deviation can’t.
Related Calculators
Start with the Variance Calculator and Standard Deviation Calculator for the foundational measures, visualize the Empirical Rule Calculator and Normal Distribution Calculator for exact probabilities, locate individual points with the Z-Score Calculator, and compare variability across datasets with the Coefficient of Variation Calculator.
External Resources
- 68–95–99.7 rule — Wikipedia — background and exact derivation of the empirical rule percentages
- NIST/SEMATECH e-Handbook of Statistical Methods — official reference for variance, standard deviation, and related statistical methods