NDVI Explained: How Satellites Turn Light Into a Vegetation Health Map
NDVI doesn't measure how green a plant looks — it measures a light contrast humans can't even see. The real formula, history, and satellite bands behind it.
NDVI Explained: How Satellites Actually See Vegetation Health
A satellite can’t tell “green” from a photo the way you’d expect — it sees vegetation health through a light contrast in a wavelength humans can’t even perceive. NDVI, the standard behind almost every satellite crop-health and vegetation map you’ve seen, is that specific measurement.
The Core Insight: Why Near-Infrared, Not Green
A healthy leaf’s internal cell structure (the mesophyll layer) strongly reflects near-infrared (NIR) light, while chlorophyll strongly absorbs red light to fuel photosynthesis. That contrast — high NIR reflectance paired with low red reflectance — is essentially unique to living, healthy vegetation. Bare soil, water, pavement, and dead plant material don’t produce this same pattern, which is exactly what makes it a reliable signal instead of a coincidence.
Only vegetation shows low Red / high NIR — the exact contrast NDVI is built to detect
The NDVI Formula
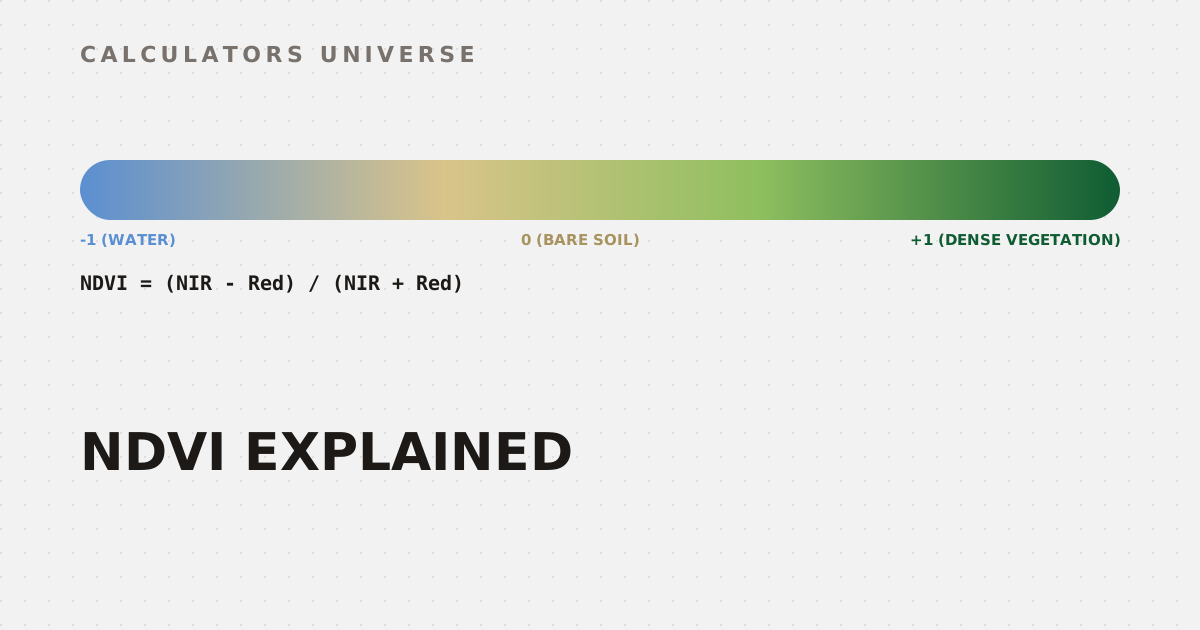
NDVI = (NIR − Red) / (NIR + Red), always producing a value between −1 and +1. Dense, healthy vegetation typically scores 0.6 to 0.9; sparse or stressed vegetation falls around 0.2 to 0.5; bare soil sits near 0; and water — which absorbs NIR strongly rather than reflecting it — usually scores negative.
The full NDVI scale, from open water through bare ground to dense healthy canopy
NDVI was developed by Rouse et al. in 1973–1974 using data from NASA’s ERTS-1 satellite (later renamed Landsat 1) — making it one of the earliest and still most widely used vegetation indices in remote sensing. Calculate NDVI directly from red and NIR reflectance values with the NDVI Calculator.
Where the Bands Actually Come From
Real-world NDVI is computed from specific satellite sensor bands, not generic “red” and “near-infrared” labels:
| Satellite | Red Band | NIR Band |
|---|---|---|
| Landsat 8 / 9 | Band 4 | Band 5 |
| Sentinel-2 | B4 | B8 (also B8A) |
Working directly from real Sentinel-2 or Landsat 8/9 imagery — rather than manually entered reflectance values — is exactly what the Satellite Index Calculator does: upload the band GeoTIFFs and it computes NDVI (plus its sibling indices below) with statistics and a pseudocolor preview, entirely in your browser. Before running the math, confirm you actually have the right bands, CRS, and extent with the GeoTIFF Metadata Reader.
NDVI’s Siblings: NDWI, NDSI, and NBR
NDVI’s red/NIR contrast trick generalizes to other surface properties using different band pairs:
- NDWI (Normalized Difference Water Index, McFeeters 1996):
(Green − NIR) / (Green + NIR)— detects open water and flooding, since water reflects green light but absorbs NIR strongly. - NDSI (Normalized Difference Snow Index):
(Green − SWIR) / (Green + SWIR)— detects snow cover, which reflects green light but absorbs shortwave-infrared. - NBR (Normalized Burn Ratio):
(NIR − SWIR) / (NIR + SWIR)— maps wildfire burn severity, since healthy vegetation has high NIR/low SWIR reflectance while burned areas flip that pattern.
All four indices are computed together from the same uploaded imagery with the Satellite Index Calculator.
Practical Resolution Considerations
Pixel size determines how finely an NDVI map can actually resolve stress patterns on the ground — a 10-meter Sentinel-2 pixel covers a much smaller, more precise area than a 30-meter Landsat pixel, which matters directly for field-scale agricultural monitoring versus regional-scale land cover work. Check exact raster dimensions and file size for your extent and pixel size with the Raster Resolution & File Size Calculator.
Beyond Color: Adding Terrain Context
An NDVI map alone can’t tell you why a patch reads low — it could be genuine crop stress on flat, fertile ground, or simply a rocky outcrop on a steep slope where nothing grows well regardless of health. Pairing NDVI with terrain data resolves that ambiguity: check slope and aspect directly from a DEM with the DEM Slope & Aspect Calculator, or read gradient and terrain shape from a topographic map with the Contour Interval Calculator.
Frequently Asked Questions
What does a negative NDVI value mean?
It almost always indicates open water, since water absorbs near-infrared light strongly instead of reflecting it, producing a negative Red-vs-NIR contrast.
Why does NDVI use near-infrared instead of visible light?
Because the NIR/Red contrast is specific to living vegetation’s internal leaf structure and chlorophyll activity — visible “greenness” alone can’t distinguish healthy plants from other green-tinted surfaces as reliably.
What counts as a good NDVI value for healthy crops?
Values from about 0.6 to 0.9 typically indicate dense, healthy vegetation; values between 0.2 and 0.5 often suggest sparse cover or plant stress, though exact thresholds vary by crop and growth stage.
What’s the difference between NDVI and NDWI?
NDVI uses Red and NIR bands to detect vegetation health; NDWI uses Green and NIR bands to detect open water and flooding — different band pairs targeting different surface properties.
Who invented NDVI, and when?
Rouse et al. developed it in 1973–1974 using imagery from NASA’s ERTS-1 satellite (renamed Landsat 1), making it one of the oldest satellite-derived vegetation indices still in standard use today.
Related Calculators
Start with the NDVI Calculator for quick reflectance-value math, or work directly from real satellite imagery with the Satellite Index Calculator (which also computes NDWI, NDSI, and NBR). Verify your source imagery first with the GeoTIFF Metadata Reader and Raster Resolution & File Size Calculator, then add terrain context with the DEM Slope & Aspect Calculator and Contour Interval Calculator.
External Resources
- Normalized difference vegetation index — Wikipedia — background on NDVI’s history and applications
- Landsat Spectral Bands and Applications — NASA — official reference for satellite band assignments used in index calculations