Mean vs Median vs Mode: Which Average Is Actually Lying to You
Mean net worth for Americans in their 40s is $743,456. The median is $75,719. Same data, wildly different answers — here's which average to trust and when.
Mean vs Median vs Mode: Which Average Is Actually Lying to You
Consider this real gap: mean net worth for Americans in their 40s is $743,456. The median for the same group is $75,719 — nearly a tenfold difference, from the exact same dataset. Neither number is wrong. They’re answering genuinely different questions, and picking the wrong one is one of the easiest ways to make data say whatever you want.
Mean, Median, and Mode: Three Different Questions
- Mean — the arithmetic sum divided by count. It factors in every value, including extreme ones, which makes it sensitive to outliers.
- Median — the middle value when everything is sorted. It’s robust to outliers, since it only cares about position, not magnitude.
- Mode — the single most frequent value. It’s the only one of the three that works meaningfully for purely categorical data with no numeric order at all.
Get all three (plus range) instantly from any dataset, with full step-by-step working, using the Mean, Median, Mode and Range Calculator.
The Real-World Example: Why “Average” Wealth Lies
The wealth gap above isn’t a rounding artifact — it’s the mean doing exactly what it’s mathematically supposed to do. A relatively small number of extremely wealthy households pull the sum (and therefore the mean) up dramatically, without moving where the typical household actually sits. The median, unaffected by how extreme the top values get, stays anchored to the middle of the actual distribution. This is precisely why wealth and income statistics are almost always reported as medians in serious analysis, not means.
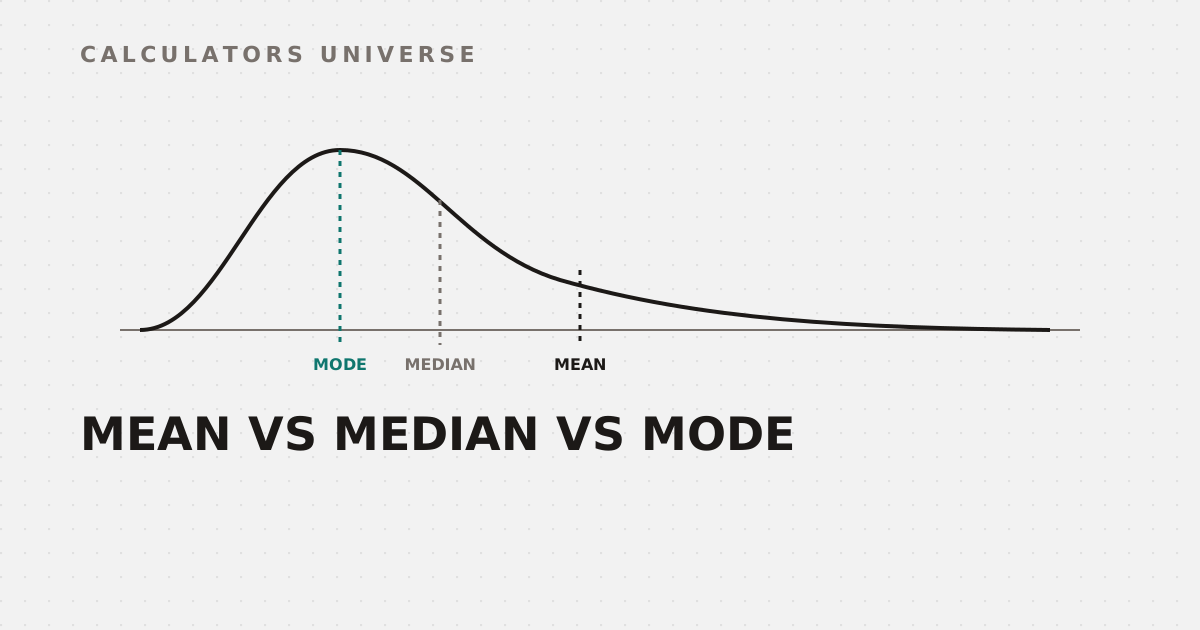
A long right tail (like a handful of extreme wealth values) drags the mean well past the median and mode
When you need a single number that reflects relative importance rather than raw values — like a GPA where credit hours matter, or a portfolio where position sizes differ — a weighted average handles that explicitly. Calculate one, with a full contribution breakdown, using the Weighted Average Calculator.
Skewness: Quantifying Which Way the Distribution Leans
The commonly taught “textbook rule” for skewed distributions: in a right-skewed (positive skew) distribution, the order from left to right is mode < median < mean. In a left-skewed (negative skew) distribution, it reverses: mean < median < mode. Worth being honest about: this rule is a useful general guide, not a mathematical law — a well-documented academic correction (published in the Journal of Statistics Education) shows real exceptions, particularly in discrete distributions, where the textbook ordering doesn’t hold. Calculate skewness and kurtosis directly, with left/right skew interpretation, using the Skewness & Kurtosis Calculator.
Interquartile Range: A More Robust Way to Measure Spread
Just as the median resists outliers better than the mean, the interquartile range (IQR = Q3 − Q1) resists outliers better than variance or standard deviation, since it’s built entirely from the middle 50% of sorted data. Statistician John Tukey’s standard outlier rule flags anything below Q1 − 1.5×IQR or above Q3 + 1.5×IQR — a threshold that catches roughly 0.7% of points in a normal distribution as outliers. Get Q1, Q2, Q3, IQR, Tukey fences, and a visual box plot with the IQR Calculator.
Seeing the Whole Shape: Frequency Distributions
Sometimes a single summary number — any of the three — actively hides what’s happening. A bimodal dataset (two separate peaks) can have a mean and median sitting in the empty valley between them, representing neither actual cluster. The only way to catch this is to look at the full shape directly. Build a complete frequency table with relative and cumulative frequencies, plus a histogram, using the Frequency Distribution Calculator.
Frequently Asked Questions
When should I use median instead of mean?
Whenever extreme values could distort the picture — income, wealth, home prices, and response times are classic cases where the median better reflects a “typical” value than the mean does.
Is the mean-median-mode skew ordering rule always true?
No — it’s a useful general pattern for many common distributions, but a documented academic correction shows real exceptions, especially in discrete data, where the textbook ordering doesn’t hold.
What is a Tukey outlier fence?
A threshold at Q1 − 1.5×IQR (lower) and Q3 + 1.5×IQR (upper) — any value beyond these bounds is flagged as a statistical outlier, a standard convention used in box plots.
Why can’t the mean represent a bimodal dataset well?
Because the mean is pulled toward the “center of mass” of the whole dataset, which can land in the low-density valley between two real peaks — a number that describes neither actual cluster in the data.
What’s the difference between a mean and a weighted average?
A plain mean treats every value equally; a weighted average explicitly accounts for each value’s relative importance (like credit hours in a GPA), which can produce a meaningfully different result from a simple average of the same numbers.
Related Calculators
Start with the Mean, Median, Mode and Range Calculator for the basics, use the Weighted Average Calculator when relative importance matters, and quantify distribution shape with the Skewness & Kurtosis Calculator. Measure robust spread with the IQR Calculator, and see the full picture with the Frequency Distribution Calculator.
External Resources
- Central tendency — Wikipedia — background on mean, median, and mode as measures of central tendency
- Mean, Median, and Skew: Correcting a Textbook Rule — the academic paper documenting exceptions to the standard skew ordering rule