FPS Calculator Math: Why Frame Time, Not Frame Rate, Decides How Smooth a Game Feels
Going from 30 to 60 FPS cuts 16.7ms off every frame. Going from 120 to 240 FPS only cuts 4.1ms. The real formula behind FPS, bottlenecks, and upscaling gains.
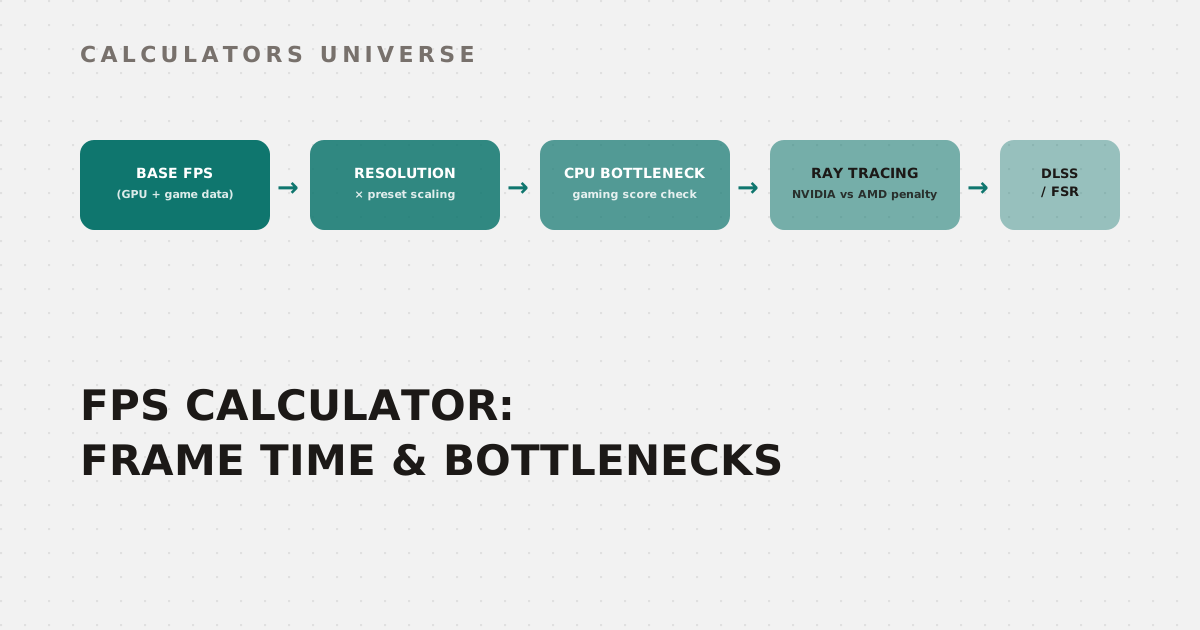
FPS Calculator Math: Why Frame Time Decides How Smooth a Game Feels
Going from 30 FPS to 60 FPS cuts 16.7 milliseconds off the time between every frame. Going from 120 FPS to 240 FPS — the same doubling — only cuts 4.2 milliseconds. Identical ratio, wildly different real-world impact, and it’s why “just get more FPS” is the wrong way to think about gaming performance. The FPS Calculator models the actual formula behind this — resolution scaling, preset scaling, CPU bottlenecks, ray tracing, and upscaling — so here’s how each piece actually works.
What Is FPS, Really?
Frames Per Second counts how many complete images your GPU renders every second. The number that actually determines how a game feels, though, is frame time — the milliseconds between each frame — calculated as:
Frame time (ms) = 1000 / FPS
| FPS | Frame time | Change from previous row |
|---|---|---|
| 30 | 33.3 ms | — |
| 60 | 16.7 ms | −16.7 ms |
| 120 | 8.3 ms | −8.3 ms |
| 144 | 6.9 ms | −1.4 ms |
| 240 | 4.2 ms | −2.8 ms |
Each doubling of FPS delivers a shrinking absolute reduction in frame time. That’s why the jump from 30 to 60 FPS is transformative and the jump from 120 to 240 FPS, while still measurable, is far more subtle — the diminishing-returns curve is doing the work, not marketing.
The Full Estimation Chain
A real FPS estimate isn’t one lookup — it’s a chain of multipliers applied in sequence. This is the actual order the FPS Calculator runs:
| Step | What it does | Typical multiplier range |
|---|---|---|
| 1. Base FPS | Looks up your exact GPU + game combination at 1080p, or interpolates from nearby GPUs if there’s no exact match | — |
| 2. Resolution scaling | Applies your GPU’s relative 1440p or 4K performance score against its 1080p score | 0.4×–1.0× |
| 3. Preset scaling | Adjusts for Low/Medium/High/Ultra graphics settings | 0.85×–1.40× |
| 4. CPU bottleneck | Reduces FPS if your CPU’s gaming score can’t keep up, weighted more heavily in CPU-intensive titles | 0.5×–1.0× |
| 5. Ray tracing | Applies a vendor-specific penalty if ray tracing is enabled | 0.52×–0.65× |
| 6. Upscaling | Applies a DLSS or FSR performance gain | 1.25×–1.80× |
Preset scaling, in detail
| Preset | Scaling factor (vs. High) | Effect |
|---|---|---|
| Low | ×1.40 | +40% more FPS than High |
| Medium | ×1.20 | +20% more FPS than High |
| High | ×1.00 | Reference baseline |
| Ultra | ×0.85 | −15% FPS vs. High |
Ray tracing penalty, by vendor
NVIDIA’s dedicated RT cores are roughly twice as efficient at ray tracing as AMD’s or Intel’s compute-shader-based approach, so the penalty isn’t the same for every GPU:
| Vendor | Ray tracing multiplier | FPS impact |
|---|---|---|
| NVIDIA | ×0.65 | −35% |
| AMD / Intel | ×0.52 | −48% |
Upscaling gain, by mode
| Mode | Multiplier | Requirement |
|---|---|---|
| DLSS Quality | ×1.35 | NVIDIA RTX only |
| DLSS Balanced | ×1.55 | NVIDIA RTX only |
| DLSS Performance | ×1.80 | NVIDIA RTX only |
| FSR Quality | ×1.25 | Any modern GPU |
| FSR Performance | ×1.55 | Any modern GPU |
If you select DLSS on a non-NVIDIA GPU, the calculator automatically substitutes FSR Quality instead of returning a nonsensical result — DLSS’s AI upscaling only runs on NVIDIA’s Tensor cores.
A Real Worked Example
Take an AMD Ryzen 7 7800X3D paired with an NVIDIA RTX 4070, running Cyberpunk 2077 at 1440p on High settings, with ray tracing on and DLSS Quality enabled:
- Base FPS at 1080p: the RTX 4070 has a direct entry for Cyberpunk 2077 — 85 FPS.
- Resolution scaling: the RTX 4070 scores 70/75 for 1440p vs. 1080p, so 85 × (70 ÷ 75) = 79.3 FPS.
- Preset scaling: High is the reference (×1.0), so it stays at 79.3 FPS.
- CPU bottleneck check: Cyberpunk 2077 isn’t flagged as CPU-intensive, and the 7800X3D’s gaming score (98) is well above the 60-point threshold that would trigger a penalty, so no reduction applies.
- Ray tracing: NVIDIA penalty of ×0.65 → 79.3 × 0.65 = 51.6 FPS.
- DLSS Quality: ×1.35 → 51.6 × 1.35 = 69.6 FPS, rounding to 70 FPS.
The calculator reports a range of roughly 59–80 FPS around that estimate, tags it “High” performance tier (60+ FPS), and — because the GPU’s 1440p score sits below the CPU’s gaming score plus a 10-point margin — flags this specific combination as GPU-bound, not CPU-bound, even with a top-tier gaming CPU in the build.
Reading the Bottleneck and Performance Tier
The calculator classifies bottlenecks by comparing your CPU’s gaming score against your GPU’s resolution-specific score, weighted differently depending on whether the game itself leans CPU- or GPU-heavy. Performance tiers give you a quick read on the outcome:
| Tier | FPS range | What it means |
|---|---|---|
| Elite | 144+ | Ready for high-refresh competitive play |
| Ultra | 100–143 | Smooth at nearly any settings |
| High | 60–99 | Comfortably playable, standard target |
| Playable | 30–59 | Functional but not ideal for fast-paced titles |
| Low | Below 30 | Expect stutter; lower settings or resolution |
How to Use the FPS Calculator
- Open the FPS Calculator.
- Select your exact CPU and GPU models — if your hardware isn’t in the list, the tool falls back to a mid-range estimate and flags it clearly.
- Pick your target game, resolution, and graphics preset.
- Toggle ray tracing and choose an upscaling mode if you use one.
- Read the estimated FPS range, performance tier, and bottleneck verdict, plus a settings recommendation tailored to your result.
Related Calculators
Look up FPS by GPU model alone with the GPU FPS Estimator, or dig into exactly which component is limiting your build with the CPU vs. GPU Bottleneck Calculator. Check whether your monitor’s refresh rate can keep up with your FPS using the Monitor Hz vs FPS Matcher, estimate the cost of full path tracing with the Path Tracing FPS Projector, confirm you have enough graphics memory with the VRAM Estimator, and size your power supply correctly with the PC PSU Calculator.
Frequently Asked Questions
Is 60 FPS still considered good for gaming?
For single-player and story-driven titles, 60 FPS remains a comfortable, widely recommended target where motion looks smooth and input lag is low. Competitive shooters and fast-paced multiplayer games have pushed the bar higher, with many players and pros preferring 144 FPS or above for the reduced frame time and sharper responsiveness it provides. Which target matters more depends entirely on the genre you’re playing.
Does increasing resolution hurt CPU performance?
No — resolution primarily loads the GPU, not the CPU, since the CPU’s job (game logic, physics, draw call submission) doesn’t change based on how many pixels get rendered. Higher resolutions typically produce lower FPS, though, which paradoxically reduces the rate at which the CPU needs to feed the GPU new frames. That’s part of why CPU bottlenecks show up more often at 1080p than at 4K.
Why does ray tracing hit AMD GPUs harder than NVIDIA?
NVIDIA GPUs include dedicated RT cores built specifically to accelerate ray-triangle intersection math, while AMD’s RDNA architecture (through RDNA 3) leans more on general compute shaders for the same task. That architectural difference is why this calculator applies a steeper penalty (×0.52) to AMD and Intel GPUs than to NVIDIA (×0.65) when ray tracing is enabled. Newer RDNA 4 hardware narrows this gap but doesn’t eliminate it.
Can I use DLSS on an AMD graphics card?
No — DLSS is proprietary NVIDIA technology that depends on Tensor cores found only in RTX-series GPUs, so it cannot run on AMD or Intel hardware. FSR is AMD’s open alternative and, unlike DLSS, runs on almost any modern GPU, including older NVIDIA cards. If you select DLSS with a non-NVIDIA GPU in this calculator, it automatically substitutes FSR Quality so the estimate still makes sense.
Why do two GPUs with similar specs give different FPS in the same game?
Real-world FPS depends on more than raw specs — driver optimization, game engine architecture, and how well a title’s code path suits a specific GPU architecture all shift results, which is why benchmark tables between review sites can vary by 10-15% for the “same” hardware. This calculator uses aggregated benchmark data and interpolates between known GPUs when there’s no exact match, then reports a confidence-adjusted range rather than a single false-precision number.
Frame rate is the headline number, but frame time, bottleneck source, and which upscaling mode you’re actually eligible for are what determine whether that number translates into a game that feels good to play.
External Resources
- NVIDIA DLSS — official technology page covering DLSS Quality, Balanced, and Performance modes
- AMD FidelityFX Super Resolution — AMD’s official documentation on FSR and supported hardware