Why Bayes' Theorem Breaks Your Intuition: The Real Math Behind Medical Test Results
An 80%-accurate test comes back positive. Most people — including doctors — guess an 80% chance of disease. The real answer is closer to 8%. Here's why.
Why Bayes’ Theorem Breaks Your Intuition
Here’s a question researcher Gerd Gigerenzer has posed to practicing physicians: a screening test correctly detects a disease 80% of the time, and produces a false positive in 9.6% of healthy people. The disease affects 1% of the population being screened. A patient tests positive. What’s the probability they actually have the disease? Most people asked — including many doctors — guess somewhere around 80%. The real answer is roughly 7.8%.
Bayes’ Theorem: The Formula
Bayes’ theorem updates a probability in light of new evidence: P(A|B) = P(B|A) · P(A) / P(B). In words: the posterior probability (what you actually want — disease given a positive test) equals the likelihood (test accuracy) times the prior (how common the condition is), divided by the overall probability of getting that evidence at all. Calculate a posterior probability directly — with a Venn diagram and full step-by-step working — using the Bayes’ Theorem Calculator.
The Classic Example: Mammography Screening
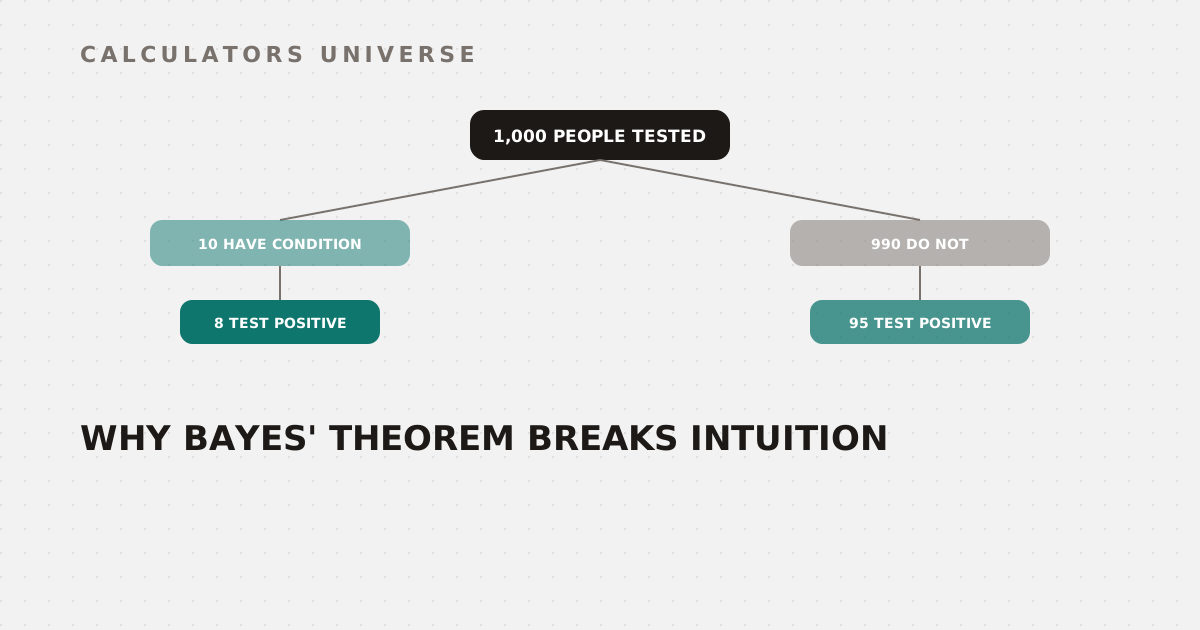
This exact scenario — 1% prevalence, 80% sensitivity, 9.6% false positive rate — comes from Gigerenzer’s widely cited research on physician reasoning. Framed as raw percentages, it’s genuinely hard to reason about correctly. Framed as natural frequencies — actual counts of real people — it becomes far clearer:
8 true positives buried among 95 false positives — the rare condition, not the test's accuracy, dominates the result
Out of 1,000 people: 10 actually have the condition, and 8 of those correctly test positive. Of the remaining 990 without it, about 95 still test positive anyway (the 9.6% false positive rate applied to a much larger healthy group). That’s 103 total positive results, only 8 of which are real — 8/103 ≈ 7.8%. Gigerenzer’s research found that this natural-frequency framing nearly tripled the rate of correct physician reasoning, from about 16% to 46%. Check any base-rate scenario against this exact “true positive” trap with the Bayesian True Positive Calculator.
Why Intuition Fails: The Base Rate Fallacy
The error has a name: the base rate fallacy — anchoring on the test’s accuracy (80% sensitivity feels like “80% chance of disease if positive”) while ignoring how rare the condition actually is. Because the healthy population is so much larger than the affected population, even a small false-positive rate applied to that huge healthy group produces more false positives in absolute terms than true positives from the small affected group. The rarer the condition, the worse this effect gets — a highly accurate test for a rare disease can still mean most positive results are false alarms. Explore the underlying set operations — union, intersection, conditional probability — that make this reasoning precise with the Probability Calculator.
Building Blocks: Distributions Behind the Numbers
The counts in the natural-frequency tree above are themselves outcomes of probability distributions. The number of true positives out of a fixed group of affected patients follows a binomial distribution — model exact and cumulative probabilities for any fixed number of trials with the Binomial Distribution Calculator. Rare, independent events over an interval — like new cases of an uncommon condition arising over a year — are often better modeled with a Poisson distribution, available with the Poisson Distribution Calculator. For any custom set of outcomes and probabilities, get the full expected value, variance, and CDF with the Probability Distribution Table Calculator.
Frequently Asked Questions
What is the base rate fallacy?
It’s the tendency to judge the probability of an event (like having a disease given a positive test) mainly by the test’s accuracy while neglecting how common or rare the underlying condition actually is — which can produce wildly wrong intuitive estimates.
Why do even doctors get this wrong so often?
Because percentages and conditional probabilities are genuinely hard to reason about directly. Gigerenzer’s research found that reframing the same numbers as natural frequencies (actual counts out of a fixed group) nearly tripled correct reasoning among physicians.
What’s the difference between a test’s sensitivity and the posterior probability?
Sensitivity is P(positive test | has condition) — how good the test is at catching real cases. The posterior is P(has condition | positive test) — what a patient actually wants to know — and the two are very different numbers unless the condition is common.
How does Bayes’ theorem update as you get more evidence?
Each new piece of evidence lets you treat the previous posterior probability as the new prior, updating again — repeated Bayesian updating is exactly how probability estimates refine as more test results or data come in.
Does a positive test always mean bad news?
Not necessarily — for rare conditions, a positive result on an imperfect test can still mean the actual probability of having the condition is low, which is exactly why follow-up testing exists and why this calculation matters.
Related Calculators
Start with the Bayes’ Theorem Calculator and the Bayesian True Positive Calculator built specifically for this exact base-rate scenario. Review the underlying set operations with the Probability Calculator, and model the distributions behind the counts with the Binomial Distribution Calculator, Poisson Distribution Calculator, and Probability Distribution Table Calculator.
External Resources
- Base rate fallacy — Wikipedia — background, examples, and the natural-frequency framing research
- Bayes’ theorem — Wikipedia — full derivation and mathematical background